Wildfire
A fuel problem, a weather problem and an ignition problem at the same time.
Wildfire risk is the chance that fire reaches a location and that it burns severely when it arrives.
What it means
Society and your property, compared.
| Society | Parcel |
|---|---|
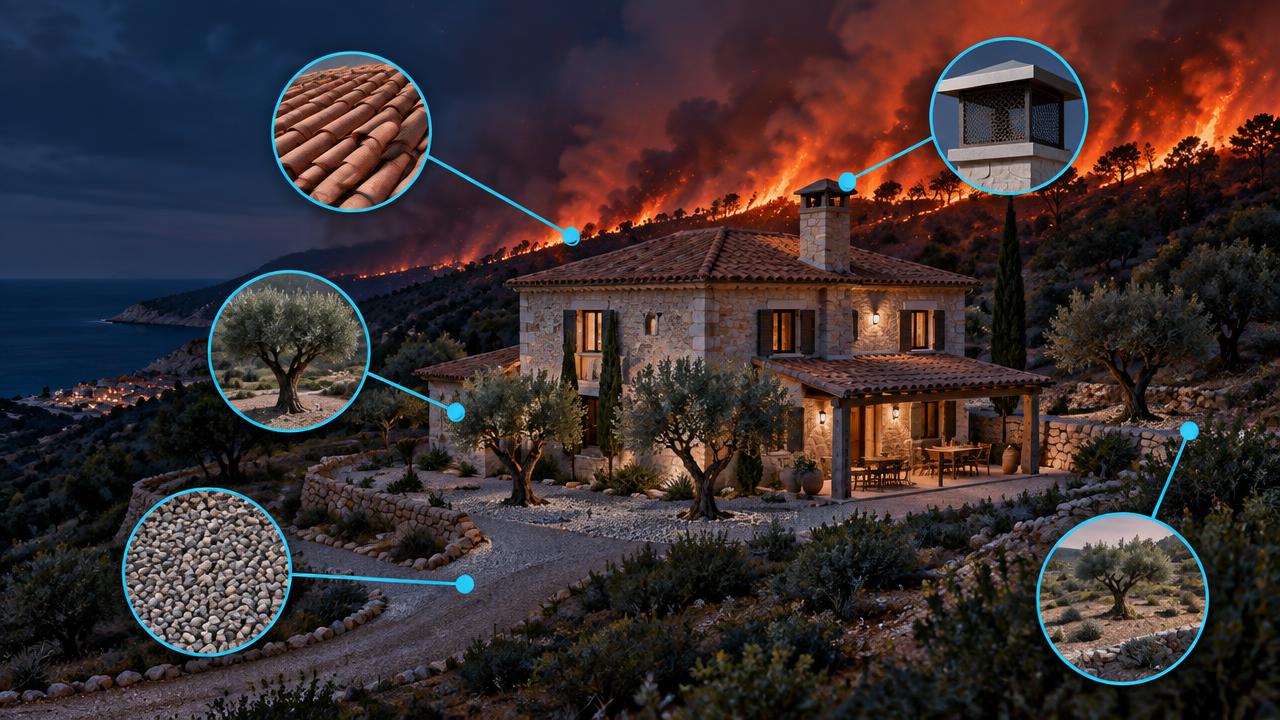
Lives and evacuation Large fires force evacuations with only hours of notice, killing residents and firefighters far from the flame front. | Ember attack Most homes burn when embers land in gutters, vents and woodpiles, often ahead of the flames. |
Rebuild cost and insurance A single interface fire can destroy hundreds of homes, making insurers withdraw or raise premiums. | Defensible space Thirty metres of cleared, managed space between the building and vegetation changes survival odds dramatically. |
Land, water and carbon Burnt slopes lose soil, ash pollutes reservoirs and mature forests need decades to recover. | Slope and position Fire runs uphill, so a house at the top of a vegetated slope faces much higher flame lengths. |
Rural economy Timber, livestock and rural tourism collapse after a fire, leaving more unmanaged fuel behind. | Access and escape A single narrow track limits firefighter access and traps residents when evacuation is ordered. |
What drives it
Physical and human causes.
- 01
Fuel dryness
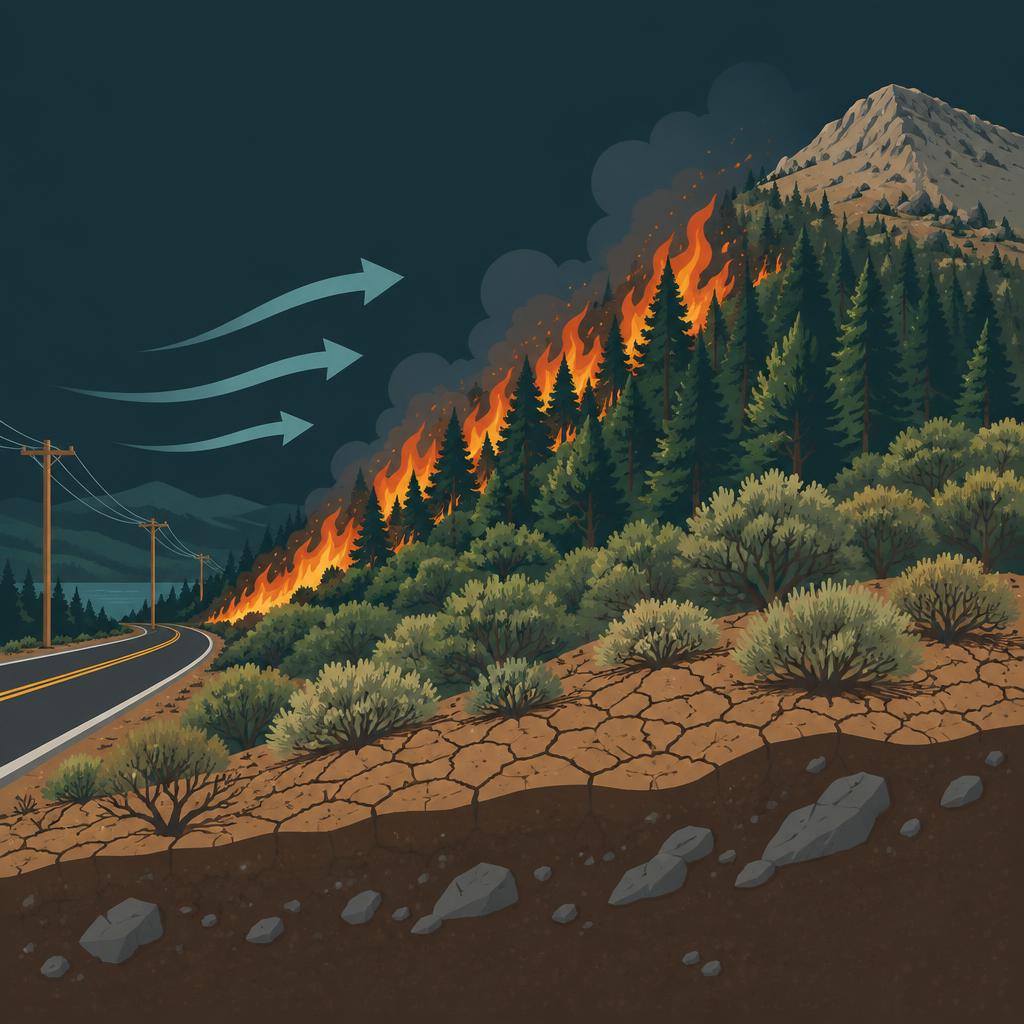
Longer, hotter droughts dry live and dead fuel, extending the season at both ends and turning normal fire weather into extreme fire weather.
- 02
Fuel continuity
Abandoned farmland and unmanaged pine and eucalyptus create unbroken fuel beds.
- 03
Wind events
Strong, dry down-slope and offshore winds produce the runs that outpace suppression.
- 04
Ignition pressure
The overwhelming majority of Spanish fires are human-caused: roads, power lines, agricultural burning and the wildland–urban interface itself.
- 05
Treeline and elevation
Above roughly 1,900–2,400 m there is simply not enough continuous fuel to carry fire, so high ground drops out of the score even in hot, dry regions.
How we score it
What sets the score.
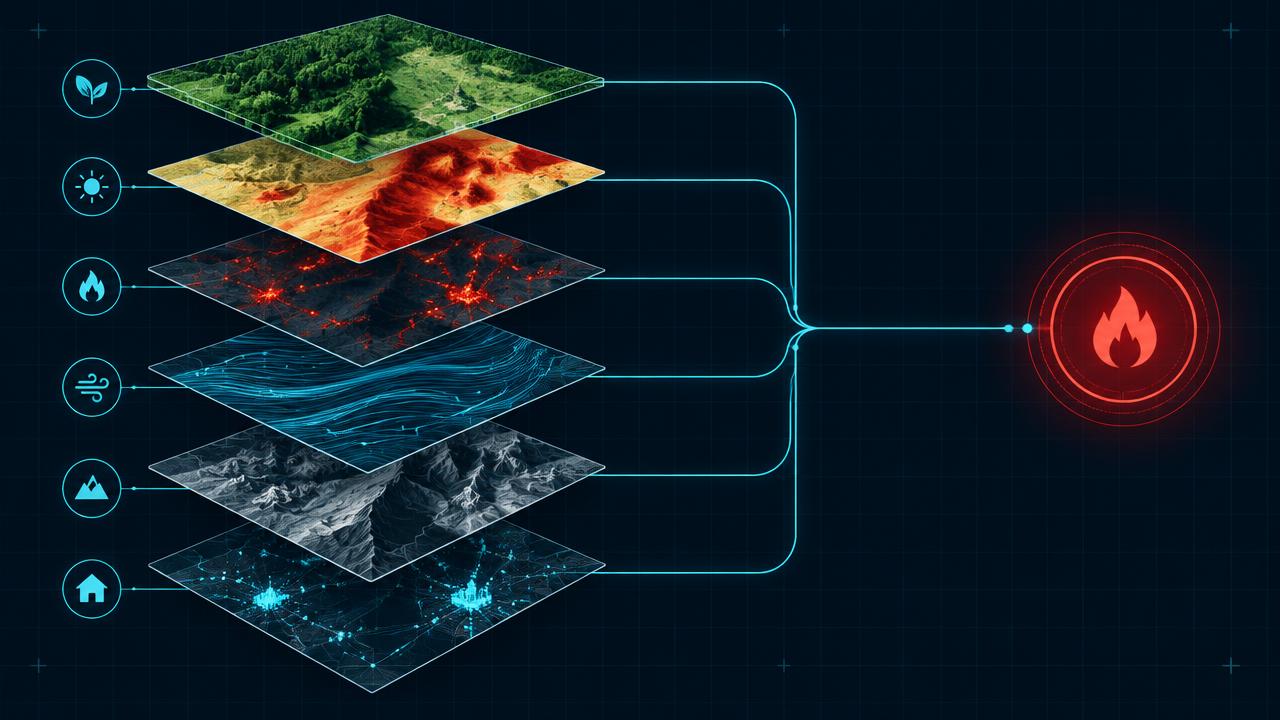
We combine six things: how dry the fuel is, how much of it there is, how often the area has burnt before, how strong and dry the winds get, how much human ignition pressure there is, and how the slope would drive a fire towards the plot.
| Factor | Weight |
|---|---|
| Fuel dryness & droughtFuel moisture deficit, from measured drought indicators and projected aridity. | 26% |
| Vegetation & fuel loadFuel type, load and continuity around the plot — forest, scrub, abandoned land or irrigated farmland. | 22% |
| Fire historyRecorded burn history and return period for the surrounding area. | 16% |
| Wind & fire weatherRegional wind and fire-weather regime, including down-slope and offshore events. | 14% |
| Human ignition pressureIgnition pressure: roads, power lines, agricultural activity and interface density. | 12% |
| Slope & aspectTerrain gradient and aspect, which set flame length and rate of spread towards the plot. | 10% |
The data layers behind it
Copernicus EFFIS
European fire danger, current and projected, plus burnt-area records behind the fire-history factor.
EEA forest fire danger (average and projected)
Regional anchor for how fire danger shifts under each climate pathway.
Copernicus drought indicators
Measured fuel dryness, so the score reflects observed conditions rather than climatology alone.
Elevation model (SRTM / GMTED, ~230 m over mainland Spain)
Slope, aspect and the treeline ceiling that removes fuel from high ground.
Land cover and Spanish Cadastre
Fuel type around the plot and the built footprint at the wildland–urban interface.
Every score is shown for a climate pathway (mid-range or high emissions) and a year out to 2100. Scores are screening-level: they tell you which hazard matters where you are and roughly how much, not what an engineering survey would conclude for a specific building.


See what this hazard does to your own address.
The parcel check is free and needs no sign-up: five hazard scores, the factors behind them, and trajectories out to 2100.