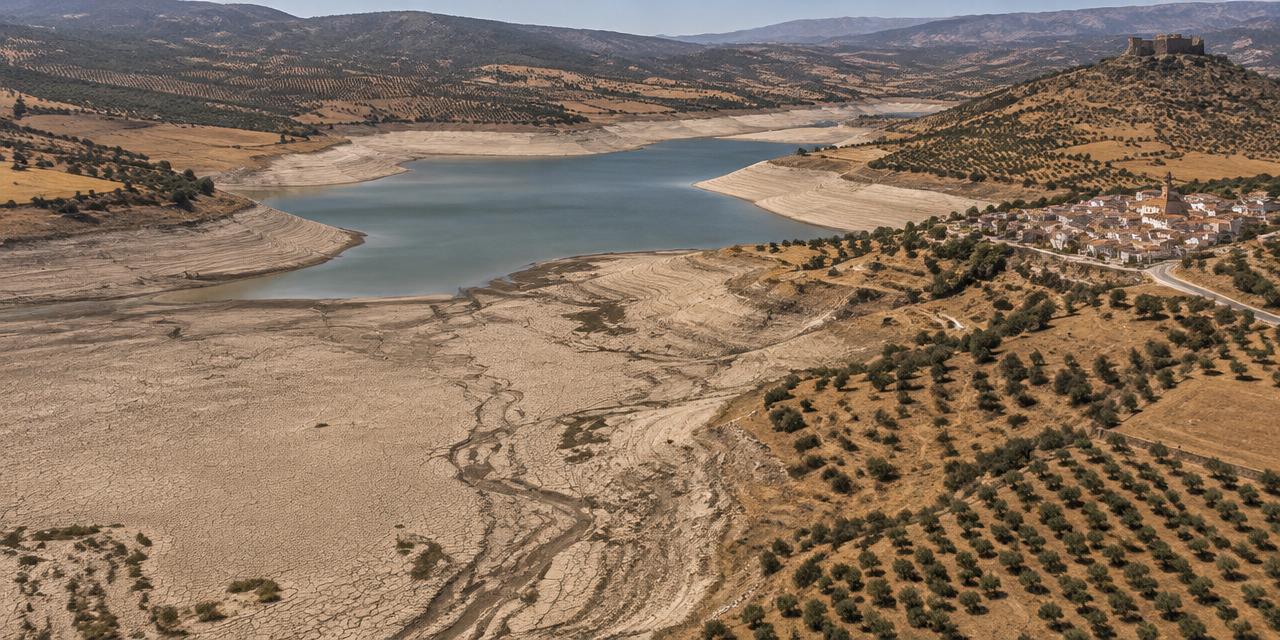
Drought & water stress
The slow hazard — it arrives without a date and leaves without one.
Drought is a persistent deficit of water relative to what a place needs.
What it means
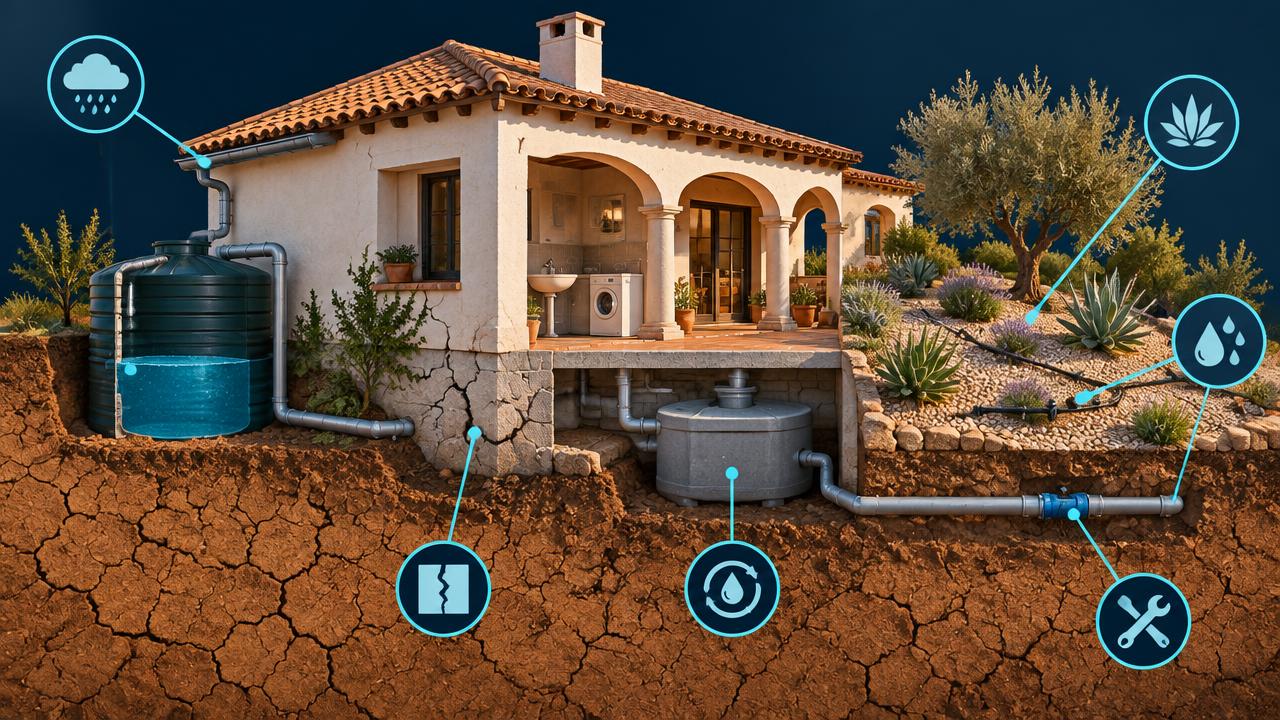
Society and your property, compared.
| Society | Parcel |
|---|---|
Water supply Water restrictions and emergency transfers hit households, tourism and small municipalities hardest. | Water availability Mains restrictions, falling well yields and rising tariffs limit what a plot can support. |
Agriculture Irrigation cuts reduce yields of permanent crops and raise livestock feed costs across the country. | Subsidence and cracking On clay soils, repeated shrink–swell cycles crack walls and foundations, a common hidden loss. |
Ecosystems Wetlands and aquifer-fed systems dry out; some losses, such as a collapsed aquifer, do not reverse. | Vegetation and land value Gardens and orchards fail without irrigation, which also raises heat and fire exposure. |
Compounding hazards Drought also dries fuel for wildfire, increases flash-flood runoff and causes building subsidence. | What helps Rainwater capture, storage, drought-adapted planting and drip irrigation all reduce the stress. |
What drives it
Physical and human causes.
- 01
Aridity trend
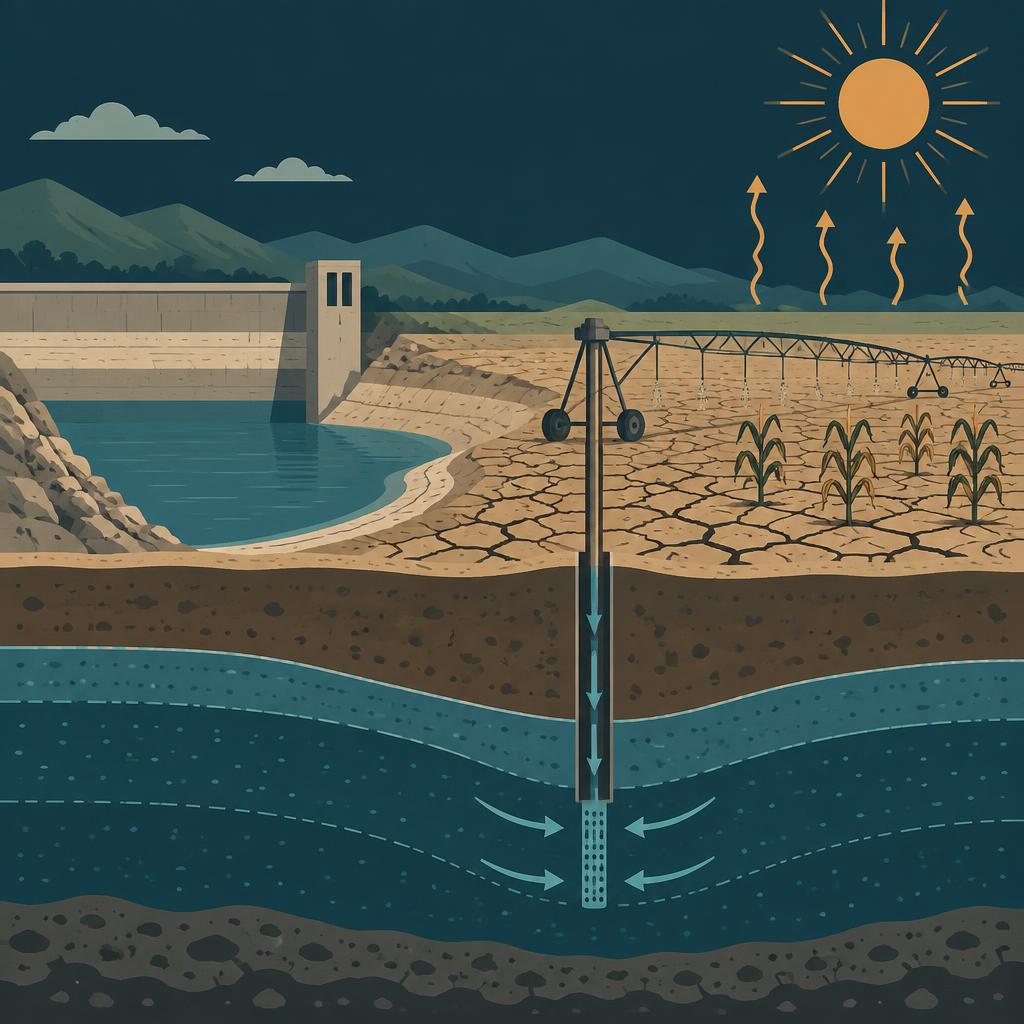
Higher temperatures raise evaporative demand even where rainfall is unchanged, so the same rain supports less.
- 02
Rainfall variability
Fewer, heavier rain events mean more water runs off and less infiltrates, so the soil-moisture deficit deepens.
- 03
Abstraction pressure
Where withdrawal exceeds recharge, the local shortage is human, not meteorological.
- 04
Soil type
Expansive clays convert a rainfall deficit directly into structural movement, which is why soil is scored alongside water.

How we score it
What sets the score.
We combine four things: how arid the place is becoming, how stressed the soil moisture is, how much pressure there is on the water resource itself, and how much the ground is likely to shrink and crack.
| Factor | Weight |
|---|---|
| Aridity & rainfall deficitRainfall deficit against evaporative demand, projected per climate pathway. | 30% |
| Soil-moisture stressSoil-moisture stress, taken from measured drought indicators where available. | 26% |
| Water-resource pressurePressure on the water resource, including officially declared over-exploited aquifers. | 24% |
| Clay shrink-swell riskShrink–swell potential of the soil, the main route from drought to building damage. | 20% |
The data layers behind it
Copernicus European Drought Observatory (Combined Drought Indicator, 5 km)
Officially classified, measured drought conditions — the observed backbone of the soil-water factor.
EEA drought frequency projections
How often drought conditions are expected under each climate pathway.
EEA water exploitation index
Ratio of withdrawal to available resource across river basins.
Declared over-exploited aquifers
A floor on water-resource pressure where a specific aquifer is formally in deficit.
Soil and land-cover data
Clay content and vegetation cover behind the subsidence factor.
Every score is shown for a climate pathway (mid-range or high emissions) and a year out to 2100. Scores are screening-level: they tell you which hazard matters where you are and roughly how much, not what an engineering survey would conclude for a specific building.
The other hazards


See what this hazard does to your own address.
The parcel check is free and needs no sign-up: five hazard scores, the factors behind them, and trajectories out to 2100.