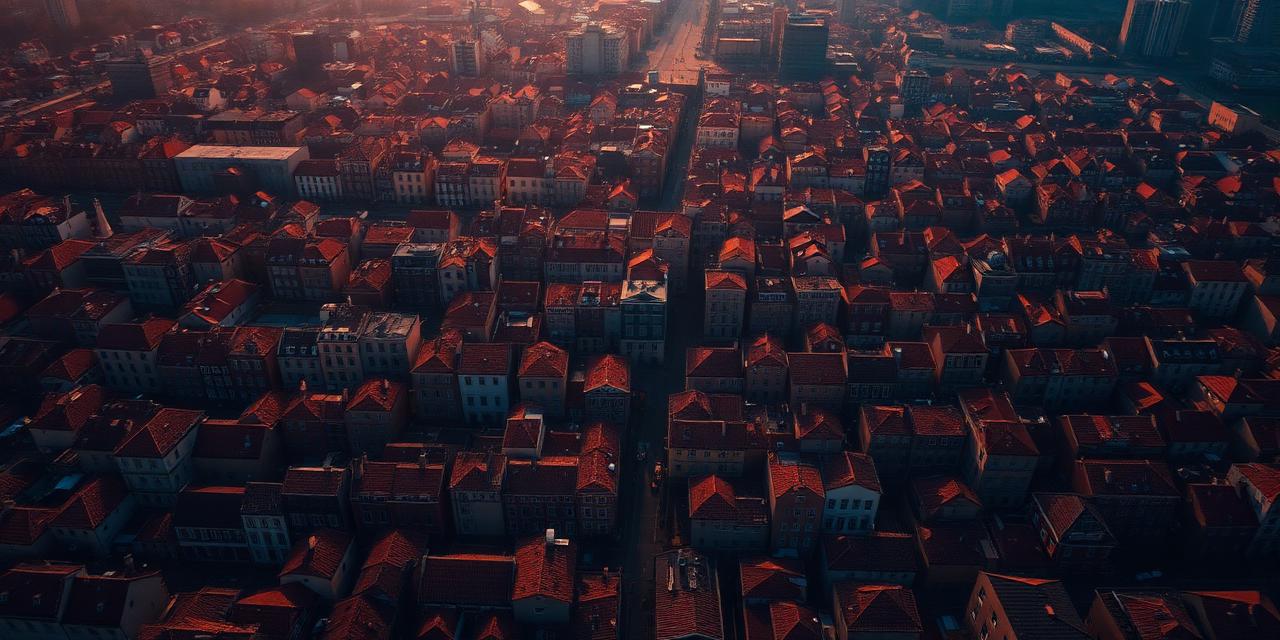
Urban heat
The hazard that kills the most people and shows on no map of damage.
Extreme heat is the combination of rising air temperature with the way a place stores and re-radiates it.
What it means
Society and your property, compared.
| Society | Parcel |
|---|---|
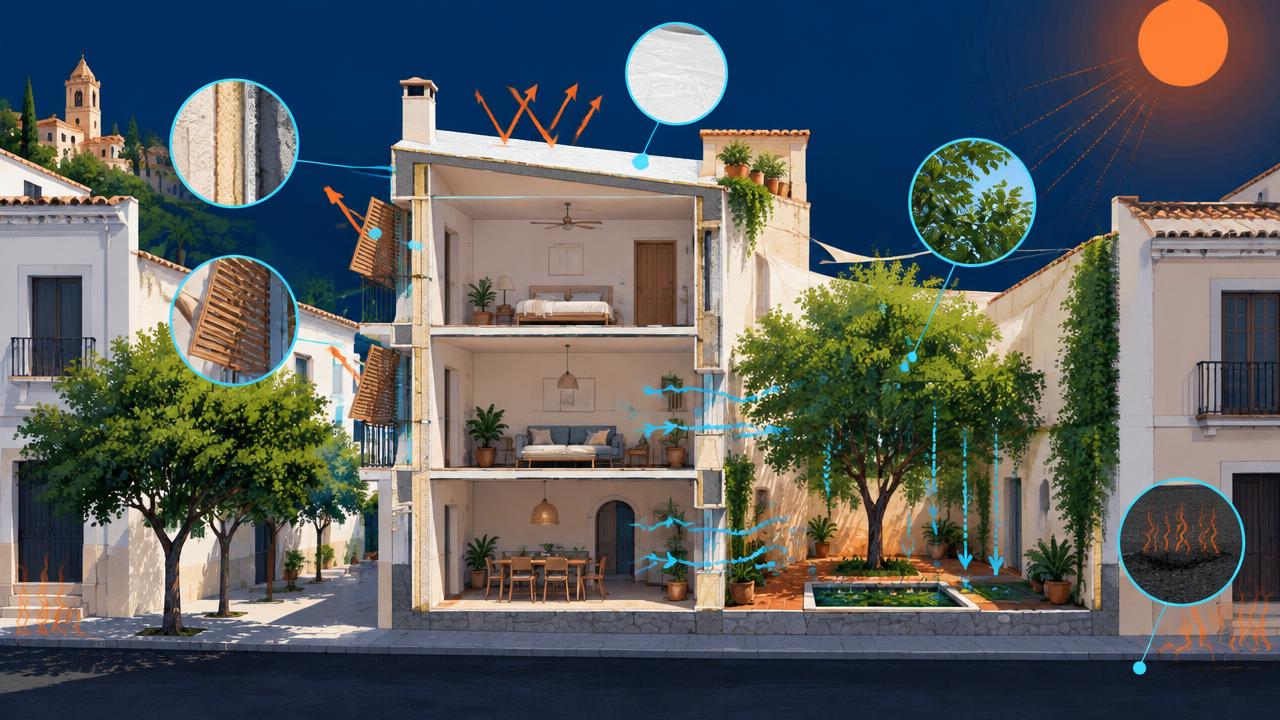
Excess mortality Heatwaves kill more Europeans than any other climate hazard, especially older people and outdoor workers. | How hot your ground runs A sealed, south-facing, treeless plot can run 8–12 °C hotter than a shaded one nearby. |
Health systems and productivity Hospitals fill up, outdoor work stops and public transport slows, spreading economic loss widely. | Night cooling Dense masonry and asphalt release heat after sunset, so indoor temperatures never recover overnight. |
Energy and infrastructure Cooling demand peaks when the grid is weakest, raising blackout risk and water demand. | Building consequences Higher cooling bills, overheating rooms and thermal stress on roofs follow the temperature rise. |
Value and liveability Unbearable summers make neighbourhoods less attractive and push retrofit costs onto owners. | What moves the number Tree canopy, reflective roofs, unsealed ground and cross-ventilation are the levers that lower it. |
What drives it
Physical and human causes.
- 01
Warming trend
Mediterranean summers warm faster than the global average, and heatwave days multiply under every scenario — the difference between pathways is how many, not whether.
- 02
Surface sealing
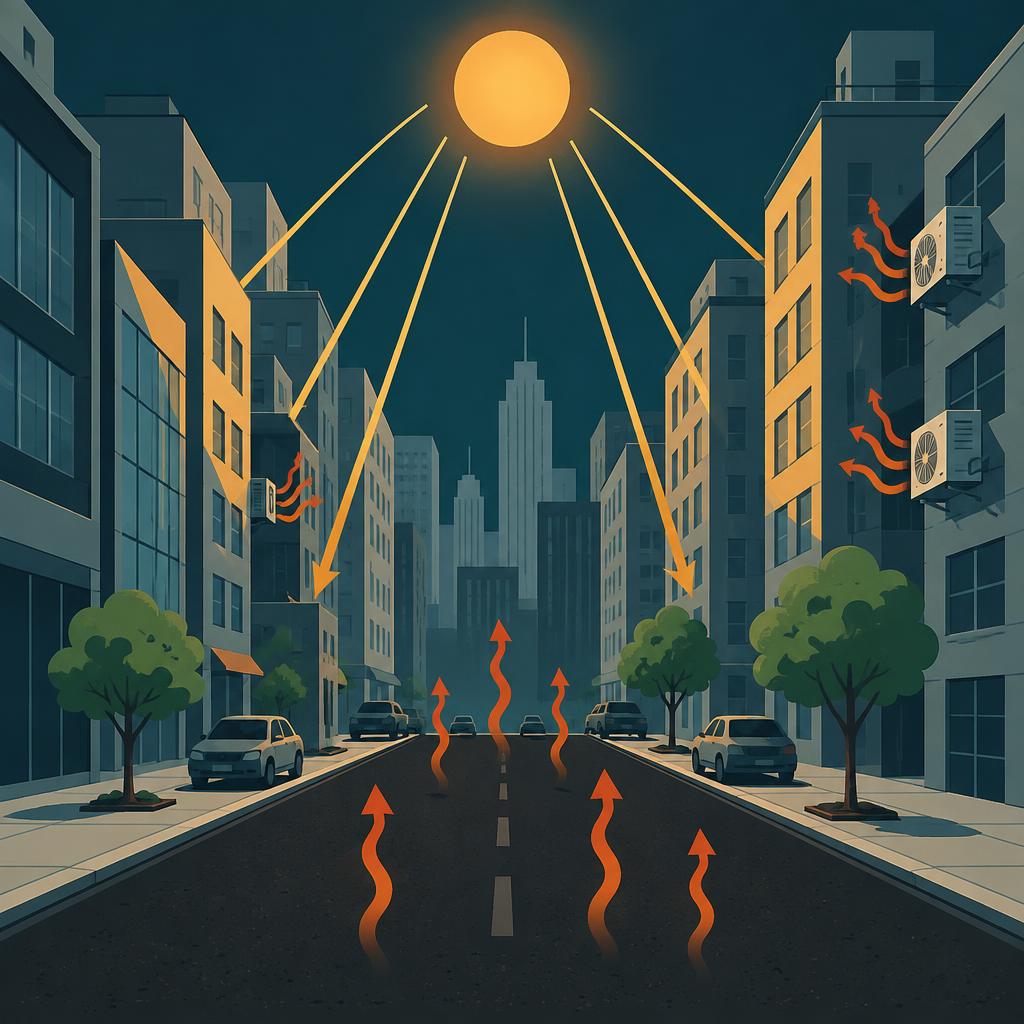
Asphalt, concrete and dark roofing absorb solar radiation and store it.
- 03
Missing canopy
Tree cover is the single most effective urban cooling measure.
- 04
Built form and waste heat
Street canyons trap long-wave radiation and block night-time sky view.

How we score it
What sets the score.
We combine five things that decide how hot a specific plot runs: how sealed and dark the surface is, how much tree canopy it has, how densely it is built, how much waste heat the surroundings add, and how badly the place fails to cool at night.
| Factor | Weight |
|---|---|
| Sealed, low-albedo surfacesAlbedo and sealing of the ground surface — how much solar energy is absorbed and stored. | 28% |
| Missing tree canopyShortfall in tree canopy and shading vegetation over and around the plot. | 24% |
| Built density & street canyonsBuilt density and street-canyon geometry, which trap radiation and block sky view. | 20% |
| Anthropogenic heatWaste heat from traffic, industry, buildings and air conditioning. | 14% |
| Night-cooling deficitFailure of night-time temperatures to fall back — the driver of heat mortality. | 14% |
The data layers behind it
EEA extreme heatwaves
Projected heatwave intensity and frequency, used as the regional anchor the local score is calibrated against.
EEA urban heat island intensity
Measured city-scale temperature excess over surrounding countryside.
Satellite land-surface temperature and land cover
Sealing, albedo and vegetation cover at the parcel scale.
Spanish Cadastre
Parcel boundary, built footprint and density of the block around it.
Every score is shown for a climate pathway (mid-range or high emissions) and a year out to 2100. Scores are screening-level: they tell you which hazard matters where you are and roughly how much, not what an engineering survey would conclude for a specific building.
The other hazards

See what this hazard does to your own address.
The parcel check is free and needs no sign-up: five hazard scores, the factors behind them, and trajectories out to 2100.